 Yegertek
Loyalty intelligence, live on your dashboard.
Yegertek's reporting layer connects your loyalty, CRM, and engagement data into Power BI dashboards — giving every stakeholder the numbers they need, in real time.
Overview
Loyalty programs generate enormous volumes of transactional, behavioural, and financial data. Without a structured reporting layer, that data sits in operational systems where it answers questions nobody asked — while the questions that matter (member lifetime value, program liability, tier migration rates, campaign ROI) require custom exports and spreadsheets.
Yegertek builds and embeds Power BI reporting workspaces directly on top of Engage 365, Puzzle, Blox, and the CRM — so program managers, finance teams, and marketing leads each get the dashboards designed for their decisions, not a generic data dump.
Your data, made visible.
Every dashboard below is a Power BI workspace configured by Yegertek, embedded directly in your program portal.
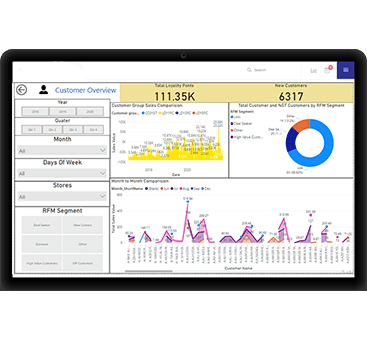
Member Overview Dashboard
Lifetime value, tier distribution, and member activity across segments.
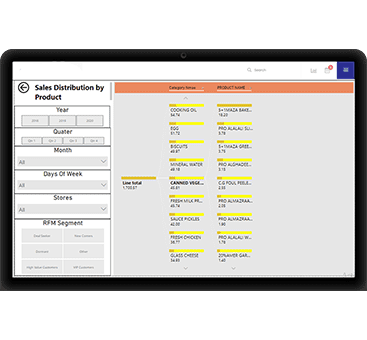
Sales & Revenue Distribution
Channel, brand, and period breakdowns of loyalty-linked revenue.
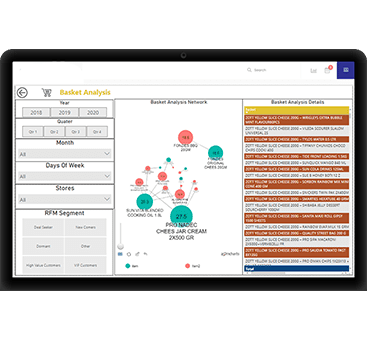
Basket & Transaction Analysis
Average basket size, co-purchase patterns, and redemption impact on spend.
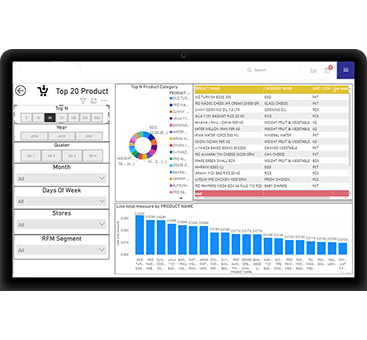
Product & Category Performance
SKU-level sales volumes and earned-points velocity by category.
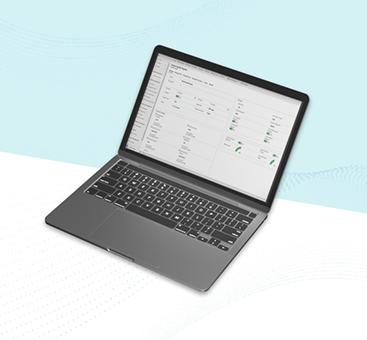
Program Performance Overview
Tier migration rates, points issuance, redemption, and liability tracking.
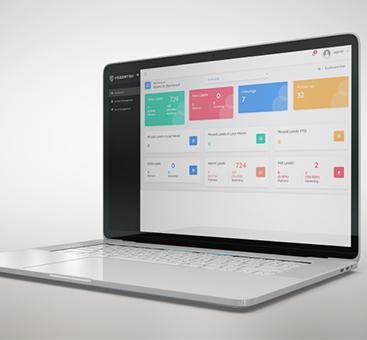
Campaign & Engagement Intelligence
Campaign ROI, offer uptake rates, and cross-channel member engagement.
Dashboards are illustrative of the standard report set. Actual configuration reflects your data model and brand.
Capabilities
Outcome-labeled features, not a laundry list.
Role-based dashboard access
Finance, operations, and marketing each see the views designed for their decisions — not a single generic report.
Real-time data refresh
Loyalty transactions and CRM events surface in dashboards as they happen — no overnight batch runs.
Tier migration & liability tracking
Monitor points issuance, redemption, and program liability continuously against your economic models.
Campaign ROI reporting
Measure every campaign's cost, redemption rate, and incremental revenue attributed to loyalty.
Member cohort & behaviour analysis
Compare acquisition cohorts, segment lifetime value, and churn risk without writing custom queries.
Cross-channel attribution
Credit loyalty correctly across in-store, e-commerce, and mobile touchpoints in one unified view.
Business Benefits
Program teams that operate from live dashboards make decisions on data that is hours old rather than weeks old. Finance teams can monitor liability exposure continuously rather than discovering variances at quarter end. Marketing can attribute revenue to loyalty without a separate data science engagement for each campaign cycle. The cumulative effect is a program that is managed rather than merely operated.
Implementation Process
Data model mapping
Yegertek maps your loyalty, CRM, and transactional data into a unified Power BI data model connected to Engage 365, Puzzle, and Rubix.
Baseline report set delivery
A configured workspace of standard dashboards — member overview, program performance, campaign ROI, and financial liability — is delivered and validated.
Role configuration & access setup
Dashboards are secured by role. Each team (finance, marketing, operations) is granted access only to the reports relevant to their function.
Embedding & handover
Reports are embedded in your program portal or admin tool via Power BI Embedded and handed over with documentation for your team to extend.
Technology Stack
- ✓Foundation: Microsoft Power BI Embedded — reports live inside your portal, branded to your programme.
- ✓Data layer: Azure Synapse Analytics for high-volume aggregated models; Dynamics 365 for live operational data.
- ✓Refresh model: Real-time for operational dashboards; configurable scheduled refresh for analytics workloads.
- ✓Access control: Row-level security by role, brand, and geography — one workspace, multiple controlled views.
- ✓Extensibility: Client teams with Power BI skills can add custom reports within the governed workspace.
Integrations
- ✓Engage 365: Points issuance, redemption, tier changes, and programme economics in real time.
- ✓Dynamics 365 CRM: Member profiles, interaction history, and service records.
- ✓Puzzle (Clienteling): Advisor interaction data and high-value member visit metrics.
- ✓POS & e-commerce: Transaction-level data via API for cross-channel attribution.
Frequently Asked Questions
See your loyalty data in Power BI.
Talk to a Yegertek specialist about your reporting requirements and see a live demo of the dashboard set.